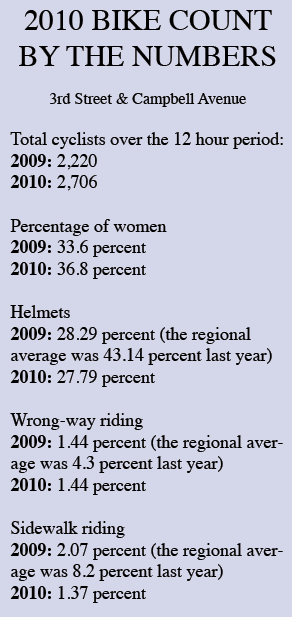
 More cyclists rode through the Campbell Avenue and 3rd Street intersection during this year’s regional bike count than last year.
While the analysis by Pima Association of Government’s Ann Chanecka showed a 21 percent increase in riders from 2009, Chanecka said it was only from one location and could not be generalized for the whole region.
The rest of the bike count data won’t be available for several months.
The intersection has traditionally been one of the most popular routes in the region. Last year, PAG decided to count cyclists for a 12 hour period there — from 7 a.m.-7 p.m. rather than the 7 a.m.-9 a.m. and 4 p.m.-6 p.m. count times the rest of the locations have.
In 2009, 2,220 cyclists rode through the intersection. This year, 2,706 cyclists were counted.
Chanecka said the increased numbers seem to indicate that last year’s record-low temperatures affected the count data. This year, rain may also have played a role in the number of cyclists on the road during the count.
Chanecka said next year she is considering changing the count to prevent the weather from playing such a big role in the data collection by counting locations several times over a month.
Despite the increased numbers, this year, it still looks like there were more cyclists in 2008, which Chanecka said may be because gas was close to $4 a gallon in 2008.

Well, it was really, really cold last year ! My piece of the count at St Mary’s & Santa Cruz looks like it was also up from last year… last year was 167 and I counted 235 on Tuesday, with most of that just one’s and two’s at a time, except for one big ride of about 14 cyclists.
Thx Mike. I was one who passed you on Tuesday on the way to drop off my daughter at school. I just did a quick check of the historic numbers for St. Mary’s and the Santa Cruz River and it looks like the numbers are higher than 2008 numbers, when gas was sky high.
4 hour peak bike count for St. Marys/SCR:
2008 198 bikes
2009 167 boles
2010 235 bikes
The helmets thing in the purple background sidebar: do the percentages reflect those wearing helmets or those not wearing helmets? A sub header something like, “Helmets Worn” or Helmets not Worn” would clear this up.
Also, is there any serious interest by the city, the county, the whatever to validly
survey the three bike ways (Aviation, Rillito, Santa Cruz) to determine how they fit into cycle commuting?
Good point, Red Star. It should be “Wearing Helmets.” I’ll update it when I am back at my computer with the image on it.
Good point, Red Star. It should be “Wearing Helmets.” I’ll update it when I am back at my computer with the image on it.
Funny, I don’t confuse “Helmets” with “No helmets.” Just me.